CrowdCompass recently released a brand new, never before done, benchmark report on mobile event apps. The report compiles data from 2,000+ events held in 2017 that used a CrowdCompass mobile event app. This report highlights key industry averages and statistics. In addition, the collected information provides actionable ways you can improve your metrics. “This report shows how mobile is a tool planners can use to increase attendee engagement with products, sponsors, other attendees, etc.,” Brooke Gracey explained.
![Average adoption rates of top mobile event app users]() One of the things that this report highlighted was the industry average for mobile event app adoption, which is 48.5%. When asked how we should interpret this number, Brooke was really positive “Having been in the mobile event app business for many years now, I think 48.5% is great progress for average adoption!” She continued to explain why she liked this stat so much, and why an average of below 50% actually isn't that bad, "The reality is, many planners are already seeing higher than average adoption. And for those who aren't, by just scheduling a few more push notifications, setting up the in-app social feed, or using in-app gamification, they can expect to see much higher averages next year. We know planners are adopting this mobile technology for their events, but there is still a learning curve to ensure they are getting the highest adoption they need to prove ROE, and that is exactly what this report will do for them. Give them a few valuable tips and tricks.”
One of the things that this report highlighted was the industry average for mobile event app adoption, which is 48.5%. When asked how we should interpret this number, Brooke was really positive “Having been in the mobile event app business for many years now, I think 48.5% is great progress for average adoption!” She continued to explain why she liked this stat so much, and why an average of below 50% actually isn't that bad, "The reality is, many planners are already seeing higher than average adoption. And for those who aren't, by just scheduling a few more push notifications, setting up the in-app social feed, or using in-app gamification, they can expect to see much higher averages next year. We know planners are adopting this mobile technology for their events, but there is still a learning curve to ensure they are getting the highest adoption they need to prove ROE, and that is exactly what this report will do for them. Give them a few valuable tips and tricks.”
![Mobile Event Apps with Security]() “There were a few surprises, though,” Brooke explained, “I wasn’t quite sure how extra security on an event app - such as adding a password - would impact adoption and engagement metrics. I was really happy to see that extra security measures actually had a positive impact on engagement. In fact, there were 159% more engagements than an event without any password protection. These are the things you wouldn’t realize without doing this kind of research.” This is not only a really interesting stat but one that is especially important today. With the numerous data breaches that have happened recently, security concerns are on everyone’s minds. Now planners can ease attendees security concerns while helping to boost their overall metrics as well.
“There were a few surprises, though,” Brooke explained, “I wasn’t quite sure how extra security on an event app - such as adding a password - would impact adoption and engagement metrics. I was really happy to see that extra security measures actually had a positive impact on engagement. In fact, there were 159% more engagements than an event without any password protection. These are the things you wouldn’t realize without doing this kind of research.” This is not only a really interesting stat but one that is especially important today. With the numerous data breaches that have happened recently, security concerns are on everyone’s minds. Now planners can ease attendees security concerns while helping to boost their overall metrics as well.
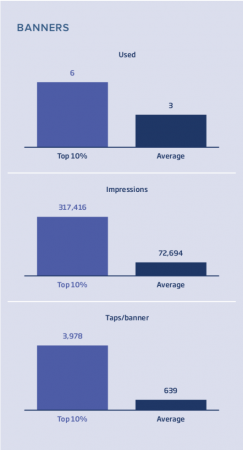
![In App Banners]()
The Brains Behind the Report
Brooke Gracey, Marketing Manager at CrowdCompass by Cvent, is the brains behind the report. She started working at CrowdCompass when mobile event apps were first being introduced. Brooke has been in the mobile event app industry for 6+ years. When it comes to mobile event apps, she knows what she's talking about! Brooke has watched as technology has grown and taken off in the past few years. Part of her role at CrowdCompass is to conduct industry research and create reports based on that information, which is why she took the lead on this report. Brooke wasn't going into this report blind. When asked about the report and if she had any predictions going in, Brooke said “I actually sat down and mapped out what I predicted the data would tell us. For example, I wanted to validate with the data that the more events a Planner uses a mobile event app for, the higher the adoption. Which makes sense, right? The more an attendee gets used to seeing a piece of technology at an event, the more likely they will be to use it”. When she finally compiled all of the data and was able to really evaluate it, Brooke said she was excited about what she saw. That's because, for the most part, her hypotheses were validated by the data.The Breakdown
Within the report, the data is separated into three groups. The overall average, the High Performers (events in the top 25%), and Top Performers (events in the top 10%). Brooke believes breaking it down really helps tie the report together as a useful tool planners can use. She explains that “By segmenting out the top performers, I was able to find simple things that any planner could do to boost their metrics. It was really interesting to see how adding more content and using an engagement feature here and there can make a big impact”."It was really interesting to see how adding more content and using an engagement feature here and there can make a big impact.”Overall, Brooke believes that “Planners understand getting people to download and use a mobile event app is leading to really valuable activities at their event that help them prove back ROE (return on event)…. This report takes a tool they may already be using and helps them understand if they are getting the best adoption and best engagement they can - so they can get the most out of this mobile onsite tool.”
Industry Average
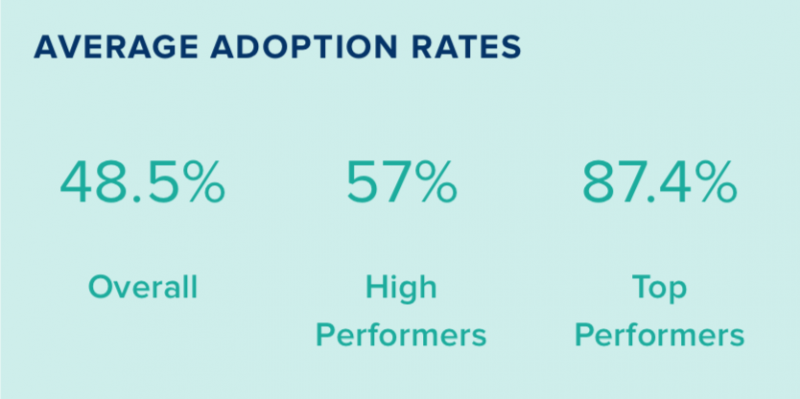 One of the things that this report highlighted was the industry average for mobile event app adoption, which is 48.5%. When asked how we should interpret this number, Brooke was really positive “Having been in the mobile event app business for many years now, I think 48.5% is great progress for average adoption!” She continued to explain why she liked this stat so much, and why an average of below 50% actually isn't that bad, "The reality is, many planners are already seeing higher than average adoption. And for those who aren't, by just scheduling a few more push notifications, setting up the in-app social feed, or using in-app gamification, they can expect to see much higher averages next year. We know planners are adopting this mobile technology for their events, but there is still a learning curve to ensure they are getting the highest adoption they need to prove ROE, and that is exactly what this report will do for them. Give them a few valuable tips and tricks.”
A Few Surprises
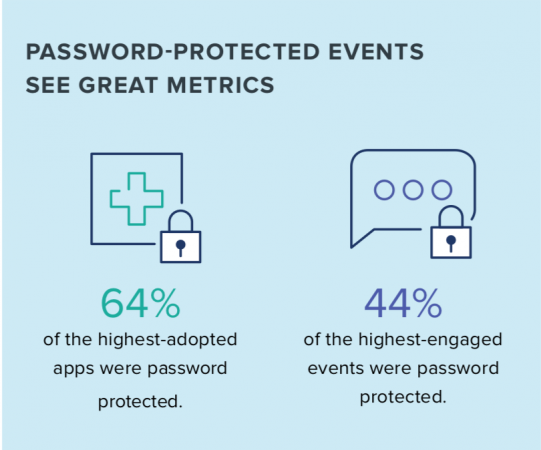 “There were a few surprises, though,” Brooke explained, “I wasn’t quite sure how extra security on an event app - such as adding a password - would impact adoption and engagement metrics. I was really happy to see that extra security measures actually had a positive impact on engagement. In fact, there were 159% more engagements than an event without any password protection. These are the things you wouldn’t realize without doing this kind of research.” This is not only a really interesting stat but one that is especially important today. With the numerous data breaches that have happened recently, security concerns are on everyone’s minds. Now planners can ease attendees security concerns while helping to boost their overall metrics as well.
“Thinking back to the days of printed guides, this is the kind of engagement we only dreamed of.”